Welcome to the Kaiser Permanente Southern California – RAND Heart Disease Mapping Portal
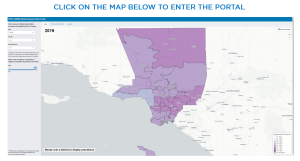 This mapping portal allows you to map hypertension prevalence by Los Angeles Health District from 2010 through 2019 (prior to the COVID-19 outbreak). You can display prevalence by sex, major race/ethnic categories and 3 broad age groups. The data comes from anonymized and aggregated Kaiser Permanente Southern California electronic health records. We used diagnoses and blood pressure measurements to identify the number of people with hypertension in each of the 26 Los Angeles Health Districts.
We only display data for adults ages 18 to 85 years to protect the privacy of the relatively smaller number of Kaiser Permanente Southern California members who are older than 85. We follow federal and state guidelines and use a multistep process to anonymize the data. Only data that, per federal and state guidelines, is considered safe to release, is shown on the map. All other estimates are marked as “not available.” Hypertension prevalence is the first of a set of health outcomes that we plan to make available through this mapping portal.
Why we developed this portal
The Kaiser Permanente Southern California-RAND Heart Disease Mapping Portal addresses the lack of local, up-to-date data to inform and support local community organizations in decision-making and advocacy. Part of Kaiser Permanente’s mission is to improve the health of the communities we serve. We provide this mapping portal to help support public health and community organizations in identifying local hypertension trends and disparities.
Why we chose hypertension prevalence to display on our map
Hypertension is the first outcome to be displayed on the Kaiser Permanente Southern California-RAND Heart Disease Mapping Portal. It was chosen because it is a common health condition that is a major risk factor for heart disease and stroke.[1] [2]
Do you want to learn more?
Below we provide the technical documentation that explains in detail how the hypertension prevalence has been calculated, the procedures to ensure safety, and how the portal and the maps are created. We also share the R-Shiny code to allow other health care systems to use our approach to make their data safely available publicly.
- How hypertension prevalence was estimated
- How we ensure data privacy
- Information Technology infrastructure and set-up
- Link to code repository (GitHub) with R-Shiny code
Need more information?
Contact us
Are you a community health organization that has feedback on our mapping portal or a health care system that wants to make your data usable for community health?
Please contact us via the link to the right.
[1] Rana, J., Oldroyd, J., Islam, M. M., Tarazona-Meza, C. E., & Islam, R. M. (2020). Prevalence of hypertension and controlled hypertension among United States adults: Evidence from NHANES 2017-18 survey. International Journal of Cardiology Hypertension, 7, 100061.
[2] Fuchs, F. D., & Whelton, P. K. (2020). High Blood Pressure and Cardiovascular Disease. Hypertension, 285–292.